
Welcome to the Skeptical Investor Newsletter. A frank, hopefully insightful, dive into real estate and financial markets. From one real estate investor to another.
Today’s Interest Rate: 6.92%
(☝️.04% from this time last week, 30-yr mortgage)
Today, we’re talkin’ US-China tariff war pause, de-escalation of foreign conflicts x3, new inflation data, new labor data, new housing data, and an interesting divergence in consumer sentiment and home purchase confidence. You won’t want to miss.
Let’s get into it.
The Weekly 3 in News:
Homebuying remains strong in 2025. Home purchase application just hit 13 consecutive weeks of YoY growth (HousingWire).
Real estate investment is poised to benefit as Congress begins debating the President’s tax proposals. Realtors call the draft plan “very positive” (NAR,CAM).
The food scene in Nashville is just starting to pick up steam. And with the New Michelin Guide is coming to the Southern US, Nashville is likely to make some notable entries (SB).

Where We Are.
The stock market is on fire this week; investors are feeling decidedly less bearish. This after:
Consumer Price inflation came in lower than expected: 2.3%,
India and Pakistan agree to a temporary ceasefire,
Putin (Russia) signals willingness to sit down with Zelensky (Ukraine),
Houthi (Yemen) - US ceasefire is positive for global trade through the Red Sea,
Presidential Executive order to lower drug prices (details really important here, could be a nothing-burger or a juicy rib-eye),
Congress is out with a draft legislation to cut taxes (some very positive real estate-related items in there, like bonus depreciation, mortgage deduction and opportunity zones),
and Secretary Bessent gave a news conference from Geneva announcing an outline for an agreement to escalate with China has been reached.
Questions remain on how all of these will manifest, but these events are extremely positive. The stock market is back to pre-tariff announcement levels.
Investors are feeling, well,,,, kinda like this today (classic flick).

Potential Pitfalls!
But it’s a tale of two cities on sentiment. Investors are feeling froggish, and consumers, skittish. Chart on:
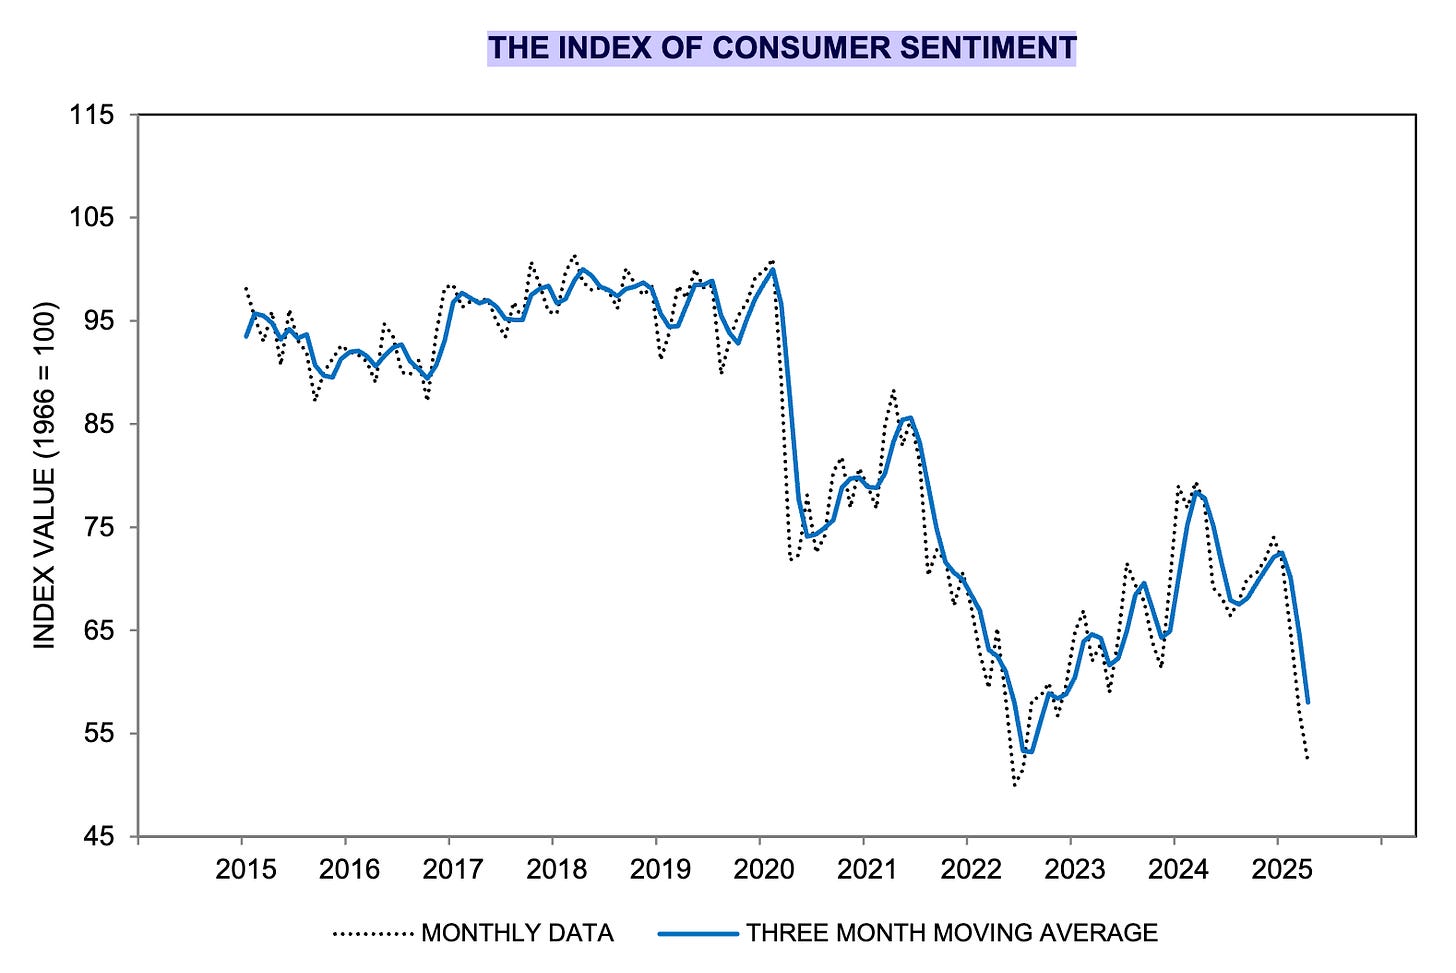
Consumer sentiment is in the pits (UMich). Uncertainty and politics are flashing on the tele all day and night. Hell, the news is the best scary movie we have today (more later, keep reading).
Potential pitfalls abound, much like the classic video game. Watch out for the crocs!

Timeless, you don’t even know kids.
Another Tariff Pause?
Ok, I don’t want to get into tariffs too much, but we have to track the progress of these negotiations.
Want to know what’s happened so far with the US-China tariff fight? Here is a visual. Almost back to where we started. For now, that is.
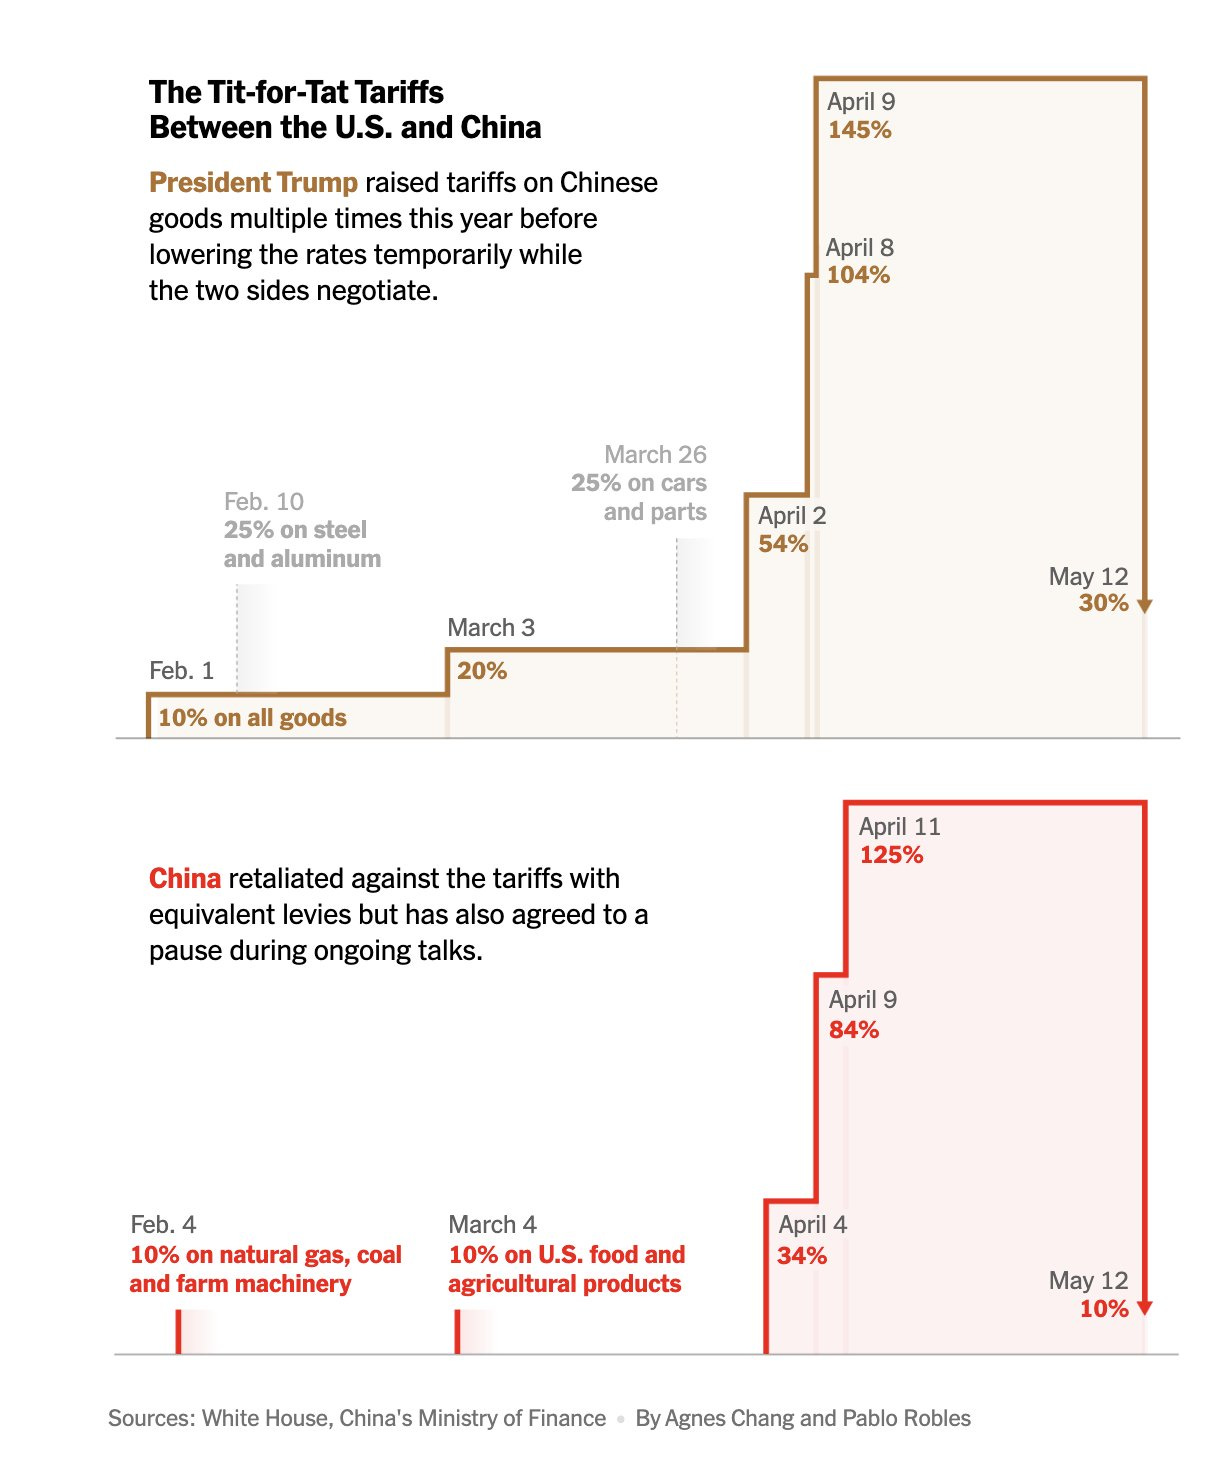
The President also said he will speak with China's President Xi "[maybe at the end of the week].”
In summary, I still do think tariffs are for negotiation purposes only and not permanent economic policy. And that’s all the time I want to spend on that (you can read my recent reflections on tariffs here).
Plastic Still Swipin’
People may feel terrible about the economy’s prospects, but they’re still spending.
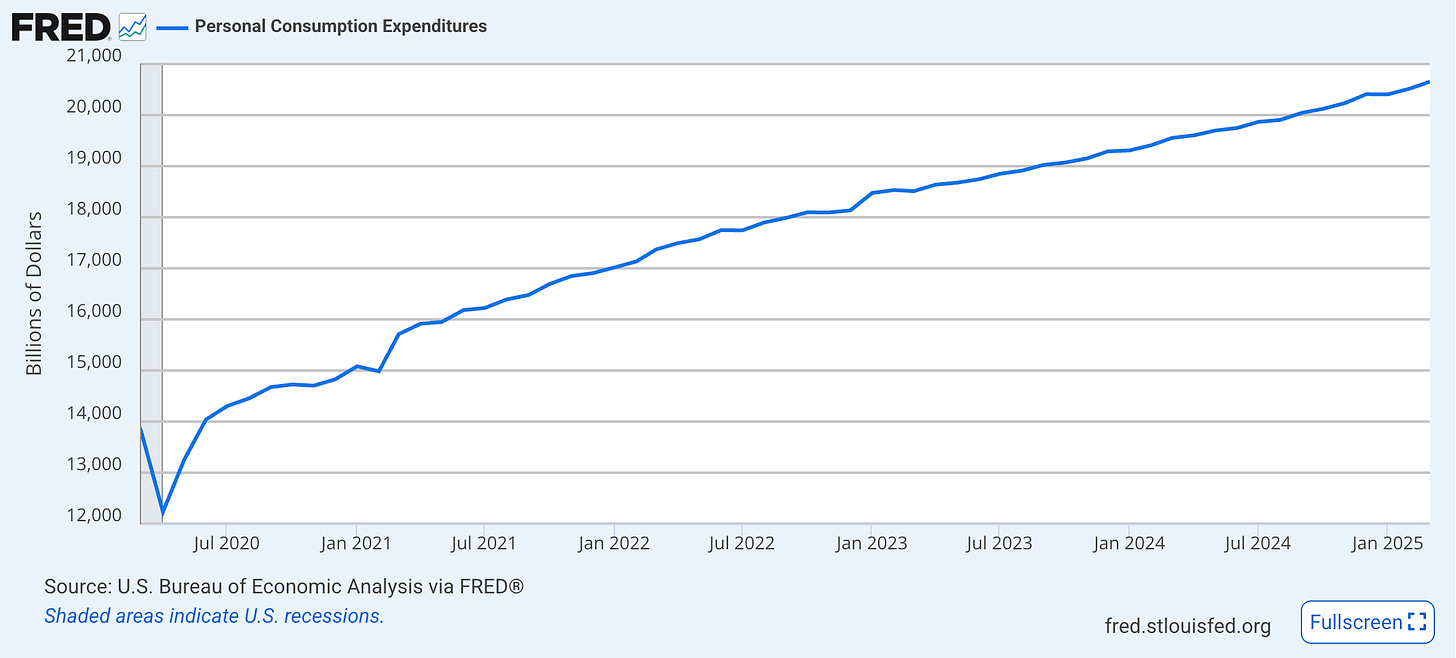
Consumer spending growth is holding steady.
Labor Market Still Strong
One reason for plastic being swiped everywhere: everyone has a job.
In April, the US economy added 177k jobs, and the unemployment rate remained unchanged at 4.2% (BLS). Of note, the unemployment has slowly levitated up for the last year and a half, albeit from a low base. I am keeping a sharp, Skeptical eye on it.
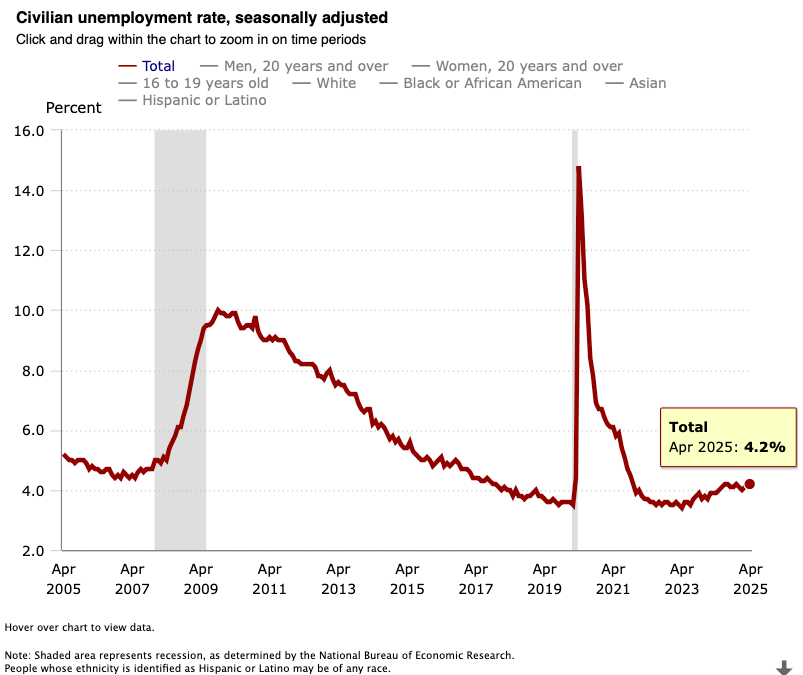
We are still at “full employment” (normally defined as sub-5% unemployment). Health care, transportation/warehousing, social assistance and finance sectors are leading the pack, with the sole major decliner being Federal Government employment, although that sector has been on a tear since 2015. Just look at the chart.
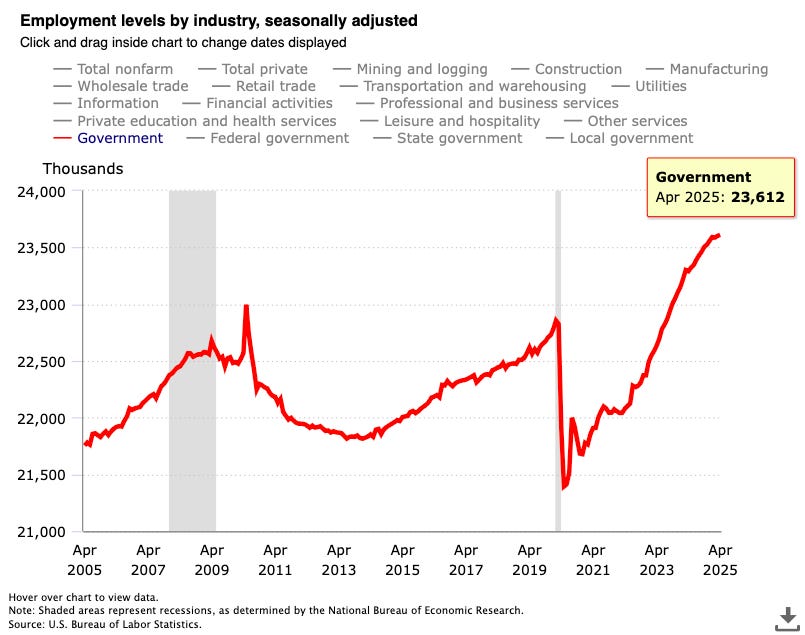
No that’s not Nvidia stock, that is government employee growth.
Not to be outdone, state and local government hiring has also been straight up and to the right (it was up again last month). Chart on:
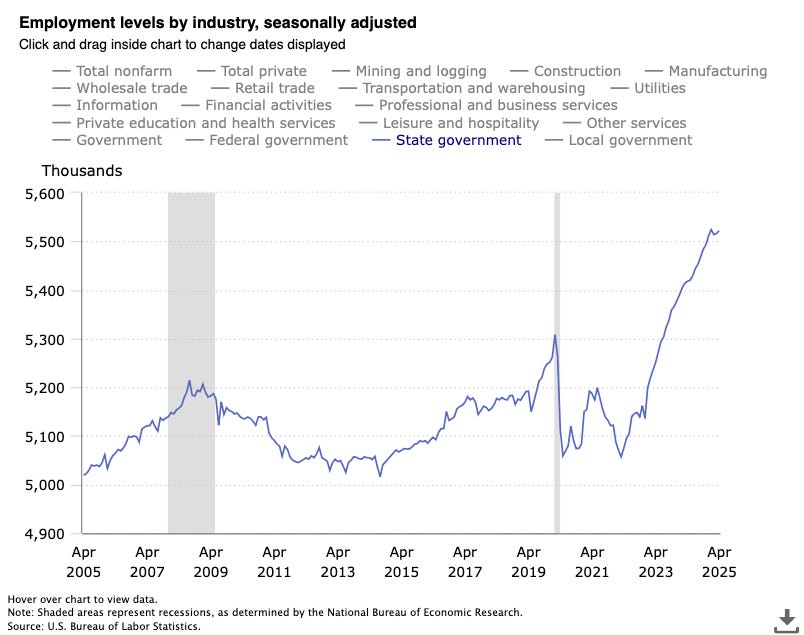
Holy toledo.
Future Economic Vibes vs Economic Data of the Past
But all this being said, the feels about the future economy are still pessimistic.
Just look at the recent CNBC headline reporting on sentiment numbers.👇
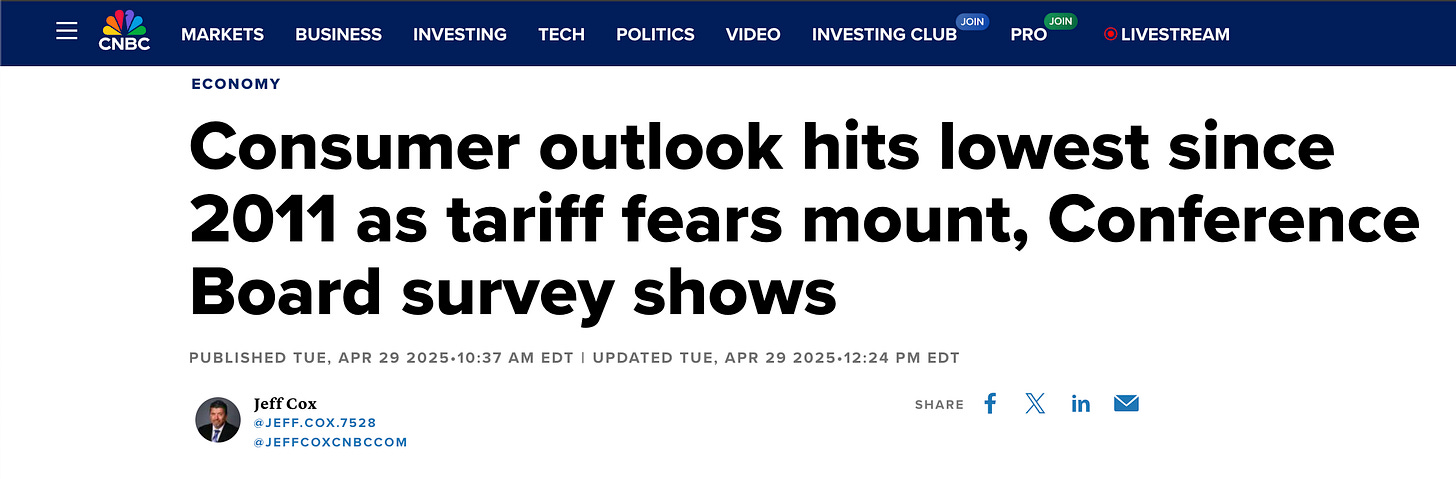
Scary!
But this is soft survey data, as opposed to hard economic data.
What’s the difference?
Hard economic data objectively measure what happened in the past, ie “Inflation in Apirl was XX%….” They tell us the way we were. By contrast, surveys attempt to inform us more about what we think and expect. Surveys can also measure more directly and quickly the repercussions of recent developments on the consumer attitudes that affect their decisions and actions, since we don’t have to wait a month to get the data. As such, consumer surveys might improve forecasts of consumer spending, business investment, labor costs, inflation, bond yields, and monetary policy.
The problem, they don’t. Survey data is a good indicator of what others are feeling, which is helpful, but they are not a good measure of what is actually happening or, as they purport, could happen.
Fed Chair Jay Powell himself has said this about survey/sentiment data:
“Sentiment readings have not been a good predictor of consumption growth in recent years.”
Remember, consumer spending is ~70% of GDP.
Using Sentiment/Survey Data
That being said, survey data can be quite useful, when we want to act contrarian, to which most successful investors endeavor.
Let’s take two recent surveys to highlight something interesting I noticed this week: the Fannie Mae survey of home purchase sentiment and the University of Michigan general consumer sentiment survey.
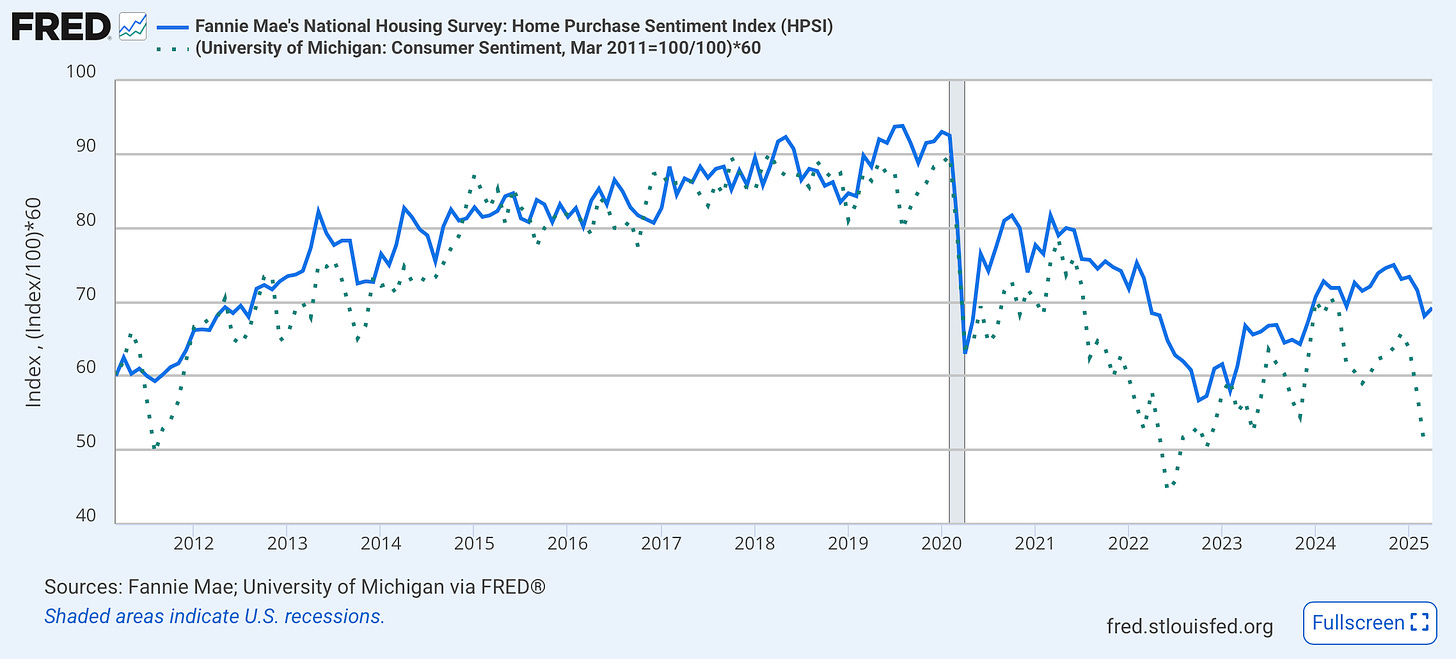
These two surveys historically track each other. But starting in 2020, large gaps can be seen in their correlation. First in the second half of 2021, then again in the middle of 2024, and now (starting in December of 2024). What do all these have in common? Tremendous uncertainty driven by inflation, interest rate expectations, and political news, the latter being the most determinative, in this author’s opinion.
Why are we looking at this? Well, we should be hyper-aware when others are acting on negative feelings/sentiments/vibes. Case in point, when interest rates were near 0% in 2021 and you could get a mortgage for ~2.7%, sentiment dropped like a rock.
The problem? This was the precise time to buy (see chart above).
So, what does this chart say about today? I see the two diverging rapidly, consumer sentiment is once again falling like a Wile E Coyote anvil, while housing sentiment is far more robust.
In my opinion, this is red-hot rodeo bullish.
Fact-based news without bias awaits. Make 1440 your choice today.
Overwhelmed by biased news? Cut through the clutter and get straight facts with your daily 1440 digest. From politics to sports, join millions who start their day informed.
Want to advertise to the more than 20,000 weekly readers of The Skeptical Investor? You can! Advertise with us; we can help you grow your business. Reach out.
Ok, back to business.
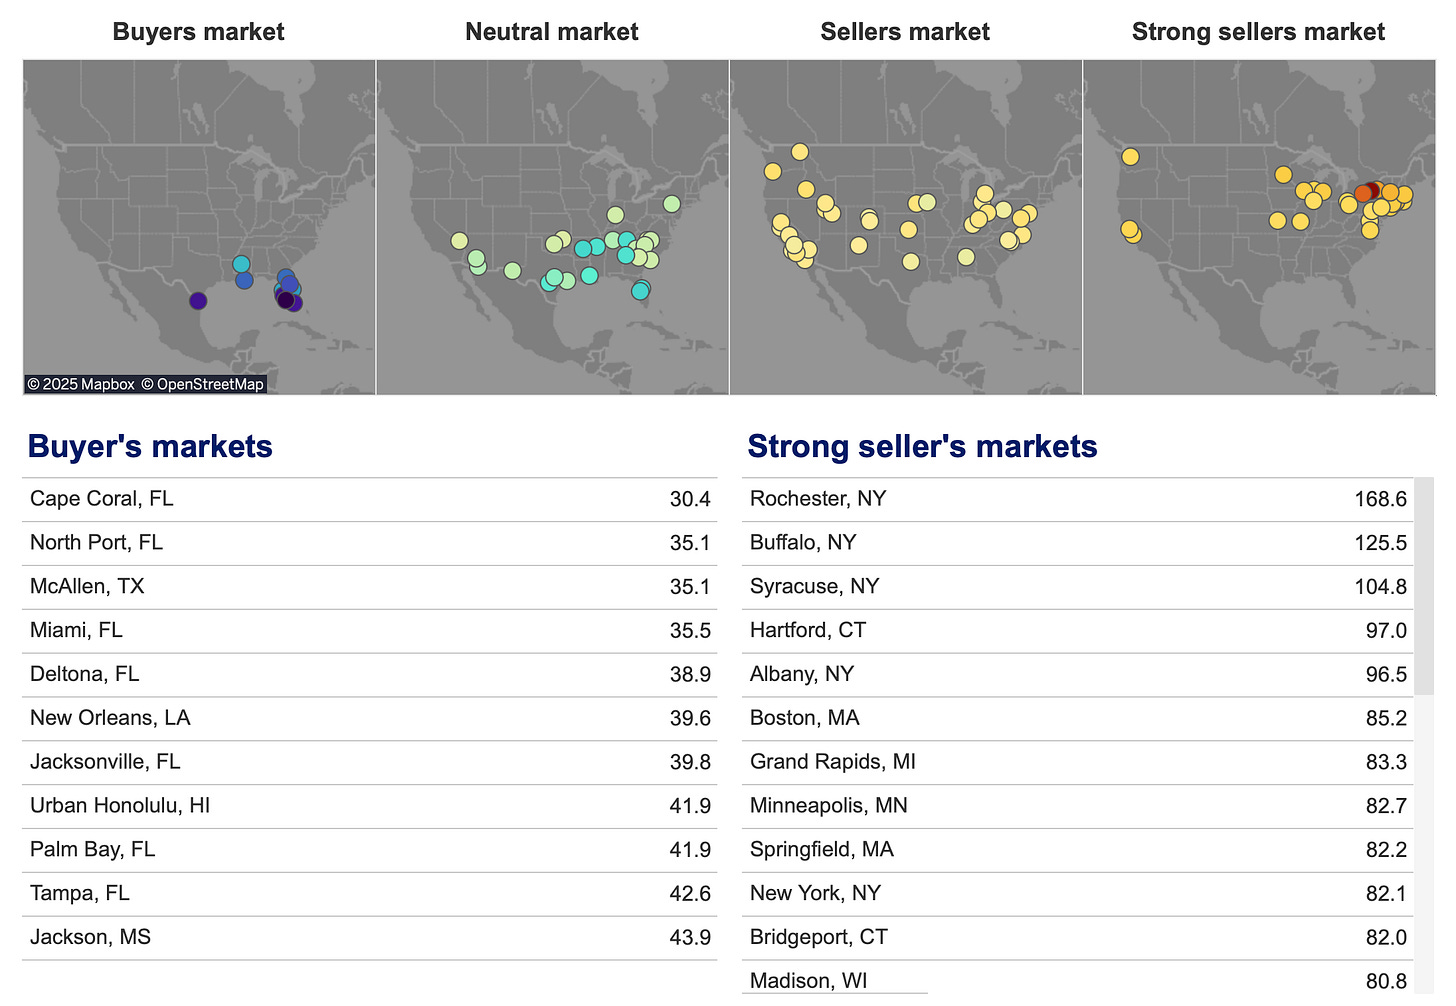
Zillow National Heat Map
Speaking of a hot market, Zillow is out with an update to their Market Heat Index and a nice interactive heat map tool showing the strongest buyer and seller’s markets. A higher score indicates a hotter metro-level housing market where sellers have more power. A lower score indicates a colder metro-level housing market where buyers have more ( the index measures Zillow user engagement on active home listings, the share of listings with a price cut, and the share of for-sale listings going pending in 21 days). power.
The strongest sellers’ markets are in the Northeast and strongest buyers’ markets are almost wholly contained to Florida. Almost the whole state. Why? High insurance, inventory, recent rapid growth…a variety of reasons.
My home market of Nashville is in a neutral posture, like much of the South. Why? Still lots of large apartment inventory coming on-market that started construction 3-4 years ago when rates were low, but our growth is simultaneously providing strong absorption of that inventory.
Now this is NOT to say one market is “better” than another. I find myself often telling fellow investors and clients that we should be deal-dependent. Inter or intra-city. For example, a great deal in a C+ class area in a buyer’s market is likely a better deal than a good deal in a B+ area in a seller’s market.
What’s a great deal? For buyers, it’s getting the property below market value, below comparable median sales (for sellers, it’s the opposite).
*** Tangent Alert! ***
Guess what also happens when we turn the heat up on real estate?…
Become a Premium Subscriber
Become a paying subscriber to get access to the rest of this post and other awesome subscriber-only content, like a one-on-one with yours truly.
Upgrade for Just $5 Today!Subscription Benefits:
- Premium Content and NO Paywall
- Subscriber-only market insights
- Breaking News Analysis
- Every article we have published - a treasure trove of information and education
- Annual one-on-one coaching with me personally! ($1000 value!)